These graphs show how hospital activity has changed in recent years. The statistics are presented for all years that have readily available data.
GP referrals
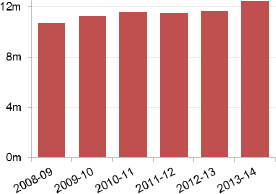
Total number of GP referrals made (all specialities) - 2008/09 - 2013/14
| Year | Number |
|---|---|
| 2008/09 | 10,640,727 |
| 2009/10 | 11,209,590 |
| 2010/11 | 11,583,243 |
| 2011/12 | 11,453,226 |
| 2012/13 | 11,671,176 |
| 2013/14 | 12,461,470 |
Source: NHS England Monthly Activity Report (MAR)
In 2013/14, GPs made nearly 12.5 million referrals. This was an increase of 17.6% from 2008/09.
Diagnostic test activity
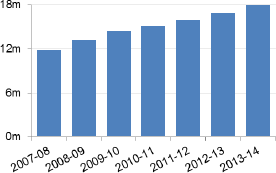
Diagnostic test activity for 15 tests in diagnostic waiting times measure - 2007/08 - 2013/14
| Year | Number |
|---|---|
| 2007/08 | 11,797,469 |
| 2008/09 | 13,158,340 |
| 2009/10 | 14,354,214 |
| 2010/11 | 15,052,374 |
| 2011/12 | 15,874,352 |
| 2012/13 | 16,846,757 |
| 2013/14 | 17,980,046 |
Source: Monthly Diagnostic Waiting Times and Activity (DM01)
The number of diagnostic tests carried out by the NHS, as measured in the diagnostic tests waiting times statistics, increased by 50.6% between 2007/08 and 2013/14 from 11.8 million to 18.0 million.
Patients seen by a specialist after an urgent referral
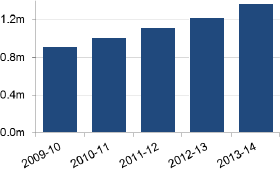
Number of patients seen by a specialist after an urgent referral from a GP for suspected cancer (all cancers) - 2009/10 - 2013/14
| Year | Number |
|---|---|
| 2009/10 | 904,209 |
| 2010/11 | 1,005,046 |
| 2011/12 | 1,108,516 |
| 2012/13 | 1,220,177 |
| 2013/14 | 1,361,345 |
Source: NHS England quarterly cancer waiting times
In 2013/14, NHS specialists saw 1.4 million patients referred from their GP because of a suspected cancer diagnosis. This was an increase of 50% from 2009/10.
Cataract operations
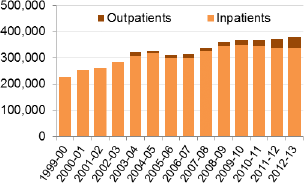
Cataract operations (FCEs and outpatient attendances) - 1999/00 - 2012/13
| Year | Number - Inpatients | Number - Outpatients | Number - Total |
|---|---|---|---|
| 1999/00 | 227,754 | 227,754 | |
| 2000/01 | 253,833 | 253,833 | |
| 2001/02 | 261,488 | 261,488 | |
| 2002/03 | 282,786 | 282,786 | |
| 2003/04 | 308,906 | 11,302 | 320,208 |
| 2004/05 | 316,205 | 10,245 | 326,450 |
| 2005/06 | 298,437 | 11,350 | 309,787 |
| 2006/07 | 301,607 | 11,382 | 312,989 |
| 2007/08 | 325,471 | 11,363 | 336,834 |
| 2008/09 | 344,591 | 14,907 | 359,498 |
| 2009/10 | 348,660 | 17,067 | 365,727 |
| 2010/11 | 343,782 | 24,108 | 367,890 |
| 2011/12 | 336,967 | 35,522 | 372,489 |
| 2012/13 | 336,638 | 39,867 | 376,505 |
Source: HSCIC annual hospital episode statistics - admitted patient care (HES APC) and outpatients (HES OP)
Between 1999/00 and 2012/13, the number of inpatient cataract procedures increased by 50.2%. Between 2003/04 and 2012/13, the number of outpatient cataract procedures carried out has more than tripled.
Knee replacements
Knee replacements (FCEs) - 1999/00 - 2012/13

| Year | Number |
|---|---|
| 1999/00 | 33,397 |
| 2000/01 | 35,827 |
| 2001/02 | 38,991 |
| 2002/03 | 45,741 |
| 2003/04 | 52,535 |
| 2004/05 | 56,652 |
| 2005/06 | 59,755 |
| 2006/07 | 63,196 |
| 2007/08 | 72,628 |
| 2008/09 | 75,306 |
| 2009/10 | 73,378 |
| 2010/11 | 76,526 |
| 2011/12 | 79,334 |
| 2012/13 | 78,841 |
Source: HSCIC annual hospital episode statistics - admitted patient care (HES APC)
In 2012/13, the NHS carried out 79,000 knee replacement operations. This was an increase of 139.8% from 1999/00.
Hip replacements
Hip replacements (FCEs) - 1999/00 - 2012/13
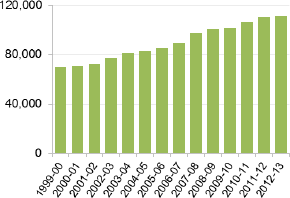
| Year | Number |
|---|---|
| 1999/00 | 69,661 |
| 2000/01 | 70,258 |
| 2001/02 | 72,271 |
| 2002/03 | 77,195 |
| 2003/04 | 81,437 |
| 2004/05 | 82,919 |
| 2005/06 | 84,914 |
| 2006/07 | 89,254 |
| 2007/08 | 97,026 |
| 2008/09 | 100,581 |
| 2009/10 | 101,020 |
| 2010/11 | 105,979 |
| 2011/12 | 109,598 |
| 2012/13 | 110,528 |
Source: HSCIC annual hospital episode statistics - admitted patient care (HES APC)
In 2012/13, the NHS carried out 111,000 hip replacement operations. This was an increase of 61.2% from 1999/00.