NHS Medical Director's View »
In the NHS and across the public sector we are committed to making sure information about the quality of our services is available and accessible to all. Making information readily available in one place allows people to hold us to account, not just for the amount of money we spend providing care but for how it is spent and what it delivers for the public. We know that there is already lots of data published on a range of websites but it can be difficult to find and harder to compare, even if you are an expert. On this site we have one place where organisations, professionals and the public can compare the performance of services across health and care, over a range of measures, and on local and national levels.

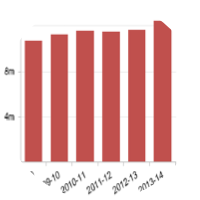
How has hospital activity changed? »
These graphs show how hospital activity has changed in recent years. The statistics are presented for all years that have readily available data.
Have health outcomes improved? »
Some causes of death, e.g. lung cancer, can be treated and as such are amenable to healthcare. The potential years of life lost through health conditions that are considered amenable have fallen by over 25% in both adult men and women in the last decade. In 2013, the potential years of lost life per 100,000 population for male adults saw a small increase, while the decrease continued for females. We will need to view this in the context of subsequent data to assess whether it is a reversal of the trend in males.
